School Attainment Data
It is a statutory requirement for schools to publish their end of Key Stage 2 data, showing the attainment achieved and progress made by children in the school by the time they reach the end of Y6.
The DfE introduced new assessment measures in 2016, to tie in with the new national curriculum and associated 'raised expectations'.
Due to the Coronavirus pandemic, statutory testing in Key Stage 1 and 2 did not take place in the summer term of 2020 or 2021. Statutory Assessments did resume in the summer term of 2022 but were not published in recognition of the disruption to schools and learning.
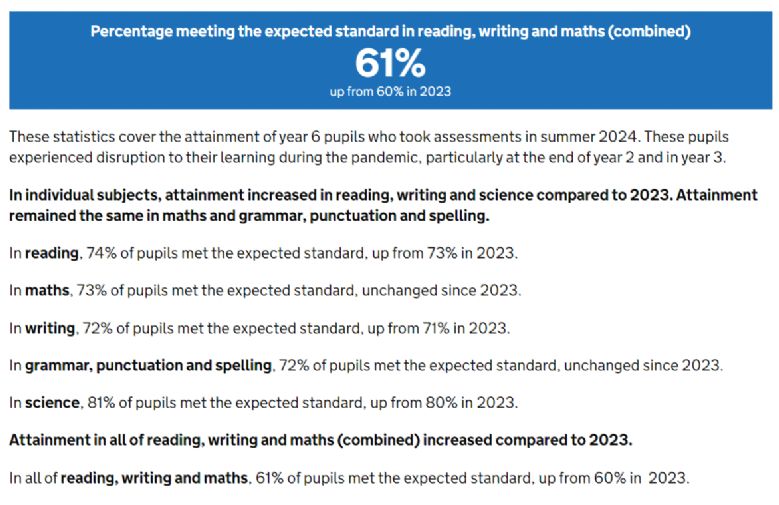
National headline data for summer 2024 from the Gov.UK website has been published. These statistics cover the attainment of year 6 pupils who took assessments in summer 2024.
KS2 Attainment
KS2 Attainment
Please find a summary of the data for our last two academic years. The analysis of yearly data informs our school development plan by identifying the areas of strength and for improvement.
|
% of cohort meeting expected standard (or above) in each subject |
2022 (19 children) |
2023 (18 children) |
2024 (22 children) |
|---|---|---|---|
|
Reading SCHOOL |
84% |
94% |
91% |
|
Reading National |
75% |
73% |
74% |
|
Writing SCHOOL |
84% |
78% |
91% |
|
Writing National |
69% |
71% |
72% |
|
Mathematics SCHOOL |
68% |
94% |
77% |
|
Mathematics National |
71% |
73% |
73% |
|
Grammar, Punctuation & Spelling SCHOOL |
74% |
83% |
86% |
|
Grammar, Punctuation & Spelling National |
72% |
72% |
72% |
|
Science SCHOOL |
89% |
83% |
91% |
|
Science National |
79% |
80% |
81% |
|
% of cohort meeting expected standard across Reading, Writing and Mathematics |
2022 |
2023 |
2024 |
|---|---|---|---|
|
SCHOOL |
63% |
66% |
77% |
|
National |
59% |
59% |
61% |
|
% of cohort working at greater depth /reaching higher standard within the subject |
2022 |
2023 |
2024 |
|---|---|---|---|
|
Reading SCHOOL |
16% |
33% |
23% |
|
Reading National |
|
||
|
Writing SCHOOL |
16% |
22% |
9% |
|
Writing National |
|
||
|
Mathematics SCHOOL |
5% |
6% |
18% |
|
Mathematics National |
|
Please find a summary of the data for our last two academic years. The analysis of yearly data informs our school development plan by identifying the areas of strength and for improvement.
|
% of cohort meeting expected standard (or above) in each subject |
2022 (19 children) |
2023 (18 children) |
2024 (22 children) |
|---|---|---|---|
|
Reading SCHOOL |
84% |
94% |
91% |
|
Reading National |
75% |
73% |
74% |
|
Writing SCHOOL |
84% |
78% |
77% |
|
Writing National |
69% |
71% |
72% |
|
Mathematics SCHOOL |
68% |
94% |
77% |
|
Mathematics National |
71% |
73% |
73% |
|
Grammar, Punctuation & Spelling SCHOOL |
74% |
83% |
86% |
|
Grammar, Punctuation & Spelling National |
72% |
72% |
72% |
|
Science SCHOOL |
89% |
83% |
91% |
|
Science National |
79% |
80% |
81% |
|
% of cohort meeting expected standard across Reading, Writing and Mathematics |
2022 |
2023 |
2024 |
|---|---|---|---|
|
SCHOOL |
63% |
66% |
77% |
|
National |
59% |
59% |
61% |
|
% of cohort working at greater depth /reaching higher standard within the subject |
2022 |
2023 |
2024 |
|---|---|---|---|
|
Reading SCHOOL |
16% |
33% |
23% |
|
Reading National |
|
||
|
Writing SCHOOL |
16% |
22% |
9% |
|
Writing National |
|
||
|
Mathematics SCHOOL |
5% |
6% |
18% |
|
Mathematics National |
|
Year 4 Multiplication Tables Check
|
MTC score out of 25 |
2022 |
2023 |
2024 |
|---|---|---|---|
|
Children achieving 22 or above |
100% |
85% |
In the Multiplication Tables Check for children in Year 4, children complete the check of 25 questions. There is not currently a pass mark threshold, however, we have followed a majority of schools in setting our pass mark at 22.
|
MTC Average Mark |
2024 |
|
|---|---|---|
|
MTC AVERAGE SCHOOL |
21% |
|
| MTC AVERAGE NATIONAL | 20% |
KS1 Attainment Data
|
% meeting expected standard or above |
2022 |
2023 |
2024 |
|---|---|---|---|
|
Reading School |
78% |
71% |
63% |
|
Reading National |
% |
68% |
|
|
Writing School |
70% |
71% |
40% |
|
Writing National |
% |
60% |
|
|
Maths School |
81% |
86% |
47% |
|
Maths National |
% |
70% |
|
|
% working at greater depth within the expected standard |
2022 |
2023 |
2024 |
|
Reading School GDS |
41% |
29% |
17% |
|
Reading National GDS |
% |
19% |
|
|
Writing School GDS |
26% |
19% |
3% |
|
Writing National GDS |
% |
8% |
|
|
Maths School GDS |
22% |
29% |
10% |
|
Maths National GDS |
% |
16% |
Year One Phonics Screen
|
% Meeting threshold (pass) |
2022 |
2023 |
2024 |
|
|---|---|---|---|---|
|
School |
100% |
83% |
87% |
|
|
National |
|
80% |
77% |
EYFS - GLD
Good level of development (GLD) Children achieving a good level of development are those achieving at least the expected level within the following areas of learning: communication and language; physical development; personal, social and emotional development; literacy; and mathematics.
|
% Achieving GLD |
2022 |
2023 |
2024 |
|---|---|---|---|
|
School |
80% |
94% |
87% |
|
Somerset |
|
||
|
National ALL |
|
67% |